AgEcon economists George Revell and Janine Powell outline the key variability of the cotton gross margin and consider a likely range for the 2020-21 cotton season.
CottonInfo and AgEcon have developed a suite of gross margins (GM) to provide an indication of the costs and revenues for growing 'best practice' cotton in a given season.
Actual costs vary from farm to farm, valley to valley and season to season depending on a range of agronomic and seasonal factors. Variations in any of the underlying variables, whether revenue or costs, will flow through to increase or decrease the enterprise gross margin and farm profit. Understanding which variables the gross margin is most sensitive to, and which variables have the potential for the greatest level of fluctuation can support enterprise risk management.
In this analysis, AgEcon presents sensitivity testing of the Furrow Irrigated Bollgard3® Roundup Ready Flex® 2019-20 GM to identify the potential GM variability, and also to understand which variables are likely to cause the greatest GM volatility.
Using a range of industry sources*, a historical range was applied to the underlying input and output variables, generating a GM probability distribution (Figure 1). This distribution shows an average GM of $3038.
Sensitivity analysis indicates that across all seasons, the average irrigated gross margin is $3038 per hectare, with 90% of years expected to fall between $1400 - $5428 per ha.
The cotton GMs are enterprise level so they need to be large enough to cover overhead and operating costs. With such a high level of GM variance across all seasons, how can a cotton grower understand the potential seasonal profitability of the crop before planting?

What is driving this potential variability in the cotton GM?
The gross margin is broken down into key income and operational cost categories to identify how they contribute to the gross margin variation. It will be no surprise to a farmer that variability is largely driven by the value of the commodity. Figure 2 ranks the sensitivity of the cotton GM to changes in income and operational costs.

Starting at the top, we can see that variation in crop income has the greatest potential to increase or decrease the GM and is therefore the greatest driver of GM risk. The long bar on the right-hand side indicates that this variable has a greater potential upside impact on the gross margin in some years. Irrigation management is also a key source of variability and risk, with the longer bar on the left-hand side indicating this cost has the potential to erode GM for some farms across the years. For some of these operational categories, multiple underlying variables contribute to the variation, for example:
- Income variation is driven by underlying variation in the lint price, lint yield, and seed price. The lint price is the primary driver of income risk, which itself is driven by the world cotton price and the AUD-USD exchange rate.
- Irrigation management is driven by the share of surface water to ground water, the proportion or water purchased on the temporary market, the temporary water price, the cost of pumping fuel price (for diesel pumps), water use efficiency, and the R&M on irrigation pumps.
Some variables contribute to risk across multiple operations, for example fuel costs affect irrigation, picking, pre-planting, in-crop, and post-crop farming, and fallow management. As an input across so many operations, and itself driven by international fuel prices and the AUD exchange rate, fuel costs generate the second highest risk among the expense items after water.
Picking, cartage and ginning costs are a per bale cost, in the analysis variability for these costs was driven by the range of average yield. Variability in the crop insurance was also driven by yield variability.
It is important to recognise that variation in the underlying variables generates both upside and downside risk. As an example, both cotton lint prices and temporary water prices are positively skewed, meaning they have higher price extremes. As an output variable, a positive skewed cotton lint price distribution generates the higher upside shown in Figure 1. In other words, higher cotton prices enable the highest GMs. Conversely, as an input variable, a positive skewed temporary water price generates the higher downside risk shown in Figure 1, potentially resulting in a negative GM for those producers that have a higher reliance on traded water.
What does the GM look like for 2020-2021 cotton season?
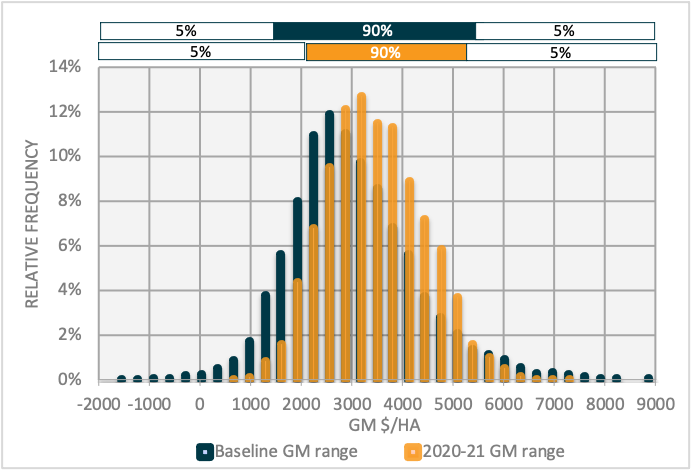
Narrowing the key variables for the 2020-21 season can give an indication of the potential GM range. For the upcoming season, forward pricing may have provided opportunities for pricing this season up to $615 / bale, however market fundamentals (the longevity of the COVID pandemic has resulted in volatile markets and lower global demand for cotton textiles) suggest that further upside for marketing this cotton crop will be limited. Tightening the range of the average cotton price for the season from the long-term average of $400 - $875 to $450 - $575 narrows the potential seasonal GM distribution (figure 3). The upside is reduced (although some upside remains with yield improvements).
Low surface water allocations in cotton growing regions initially suggest a higher dependence on bore water, along with higher associated pumping costs further reducing the GM. However, with a La Nina and a forecast wetter summer there is hope that water balances will improve, resulting in a lower dependency on bore water and temporary transfers and a lower expected temporary transfer price. Lowering the overall cost of water reduces the downside to the GM and further contributes to the narrowed distribution in Figure 3.
Where surface water allocations are available, farmers may take the opportunity to purchase temporary water allocations for the 2021 season. Individual GMs and a maximum purchase price should be strongly considered (See CottonInfo's temporary water purchase post).
Collectively, these seasonal considerations result in a narrowing of the GM range for 2020-21, with a 90% range of $2101/ha to $5222/ha, and a shift to the right with an average of $3601 (see Figure 3). Narrowing down these key variables, reduces the distribution of the cotton GM for the 2020-21 season, and therefore the enterprise risk.
While cotton lint prices are modest compared to recent years they remain above the long- term average. Together with expected improved weather conditions, this could support an above average GM in 2020-21.
Given the above identified risks, what risk mitigation resources are available to producers?
The cotton industry provides a range of resources to support risk mitigation strategies relating to both production and marketing.
- Production. Aiming for Best management practice (BMP) in production is a key method by which producers can maximise yield, and minimise production risk. myBMP is a key tool for growers to improve on-farm production and manage production risks and provides self-assessment mechanisms, practical tools and auditing processes to ensure that Australian cotton is produced according to best practice. The annually produced Australian Cotton Production Manual is another critical reference tool for cotton growers outlining all the various decisions that need to be made on-farm in preparation for, and during, cotton production. Similarly, the quarterly produced Spotlight magazine and regularly updated CottonInfo website both provide producers with access to up-to-date research in best-practice cotton production.
- Marketing. Different marketing options available to cotton producers provide a mechanism for managing two of the primary drivers of GM risk: Lint and Seed price per bale. Information on marketing options can also be found in the Cotton Production Manual.
For more: contact George Revell or Janine Powell from AgEcon.
Note:
* Historic Boyce data was used where specific variable data didn’t exist, with specific data from Namoi Cotton lint prices, Cotton Yearbook yield, ABS irrigated water usage, FuelWatch, IndexMundi fertilizer prices, NSW Gov water allocations, BOM water trade prices. For more information on this analysis including underlying data, contact admin@agecon.com.au.